Your cart is currently empty!
Biodiversity
There are more than one million species (living or extinct) identified and many more are yet to be identified in near future. The species is a distinct population. However, sub species, types and variations exist within the same population. As a result, a wide variety of organisms exist on the planet earth. Existence of varieties of life forms on earth is called Biodiversity.
Biodiversity is often replaced by the term Species Diversity. The species diversity is number of different species and relative abundance of each species present in an ecosystem. There is another term called species richness. The species richness is number of species present in a given community. Biodiversity is not evenly distributed on earth surface. Biodiversity increases from the polar region to the Tropic. The tropic is the region near to the equator. Increasing biodiversity from polar region to the tropic is called Latitudinal Diversity Gradient. Biodiversity increases with the increase in temperature. Marine biodiversity is high in Western pacific region where temperature is high.

Biodiversity hotspot
The hotspot concept was introduced by the Norman Myers. According to Norman Myers biodiversity hotspot is the biogeographical region under threat. A region must qualify two criteria to be recognized as biodiversity hotspot. These two criteria are
1. The region must have at least 1500 species of endemic vascular plants.
2. The region have lost 70% of its primary vegetation.

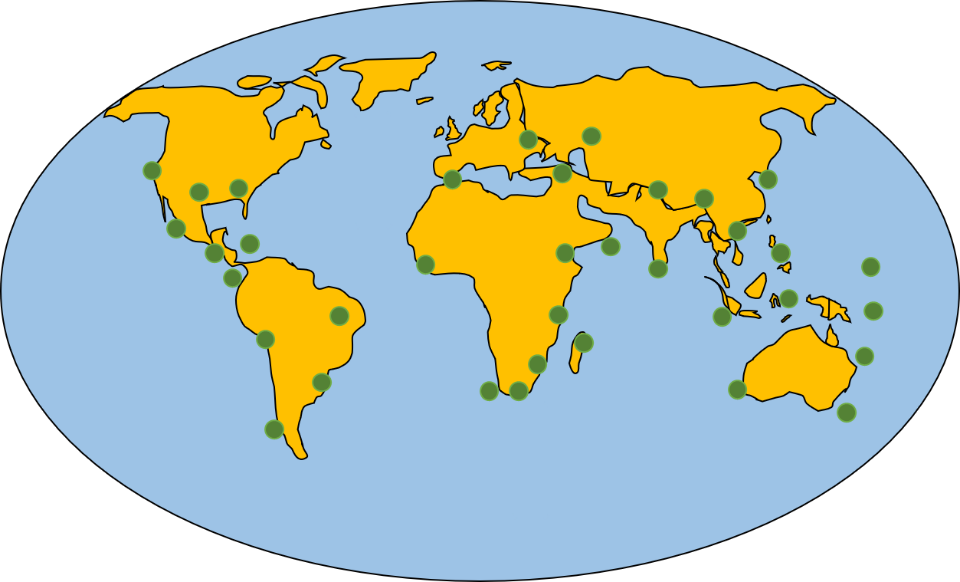
36 regions of earth surface qualify these two criteria. So, worldwide, there are 36 biodiversity hotspots according to the criteria set by Norman Myers.
| Fig: Biodiversity hotspots of the world |
Biodiversity hotspots of India
4 out of 36 biodiversity hotspots are represented by different geographical regions of India.
1. The Himalayan hotspot region: The Himalayan hotspot region of India is divided into two parts. The Eastern Himalaya and Western Himalaya. The eastern Himalaya is much richer than the Western Himalaya in terms of flora and fauna.
2. Indo-Burma hotspot region: A part of Indo-Burma hotspot region is represented by a part of Northeastern region of India and a part of Andaman Island.
3. Western Ghat hotspot region: the Western Ghat hotspot region is represented entirely by Western coastal area of India.
4. Sundaland hotspot region: the Sundaland hotspot region is represented by the Nicobar Island of India.
Each of these hotspot regions has different climatic condition with different biodiversity. They also have their own issues to be addressed. Every hotspot zone has a list of endemics as well as threatened species.
Measure of Biodiversity
Biodiversity means variation in flora and fauna. Variation of flora and fauna is measured in three levels.
1. Ecosystem Level
2. Specie level
3. genetic Level.
The Ecosystem Level
The Ecosystem level deals with study and documentation of different ecosystems that exist in the study area. Different ecosystems are documented as aquatic ecosystem, desert ecosystem, Forest ecosystem, Grassland ecosystem etc. At ecosystem level diversity of ecosystem is studied.
Species level
The species level deals with the study and documentation of different species present in each ecosystem. It includes identification of species living in certain ecosystem.
Genetic level
The genetic level deals with the identification and documentation of variation occur in the gene of a particular species.
These three levels of study describe the biodiversity of a region.
Quantitatively, biodiversity is measured in terms of species richness and species evenness.
Species richness: Number of species present in a given area.
Species evenness: Relative number of (or abundance of) individuals of each species in a given area. It is the proportion of one species to the entire population of species.
Biodiversity Index
There are many mathematical models to calculate species diversity in a given ecosystem. An Index is used to measure the degree of biodiversity of given region. The Index is a numerical figure that explains the biodiversity of a study area. There is more than one way to calculate Biodiversity Index. The two most popular biodiversity indices are
1. Shannon-Weiner Index
2. Simpson diversity Index
Shannon-Weiner Index (SDI)
The Shannon-Weiner is calculated using the following formula
H = -Σpi * ln(pi)
Simpson diversity Index (D)
The Simpson Diversity Index is calculated by using the following formula
D = Σni(ni-1) / N(N-1)
Shannon-Weiner Index is influenced by species richness (abundance of species) as well evenness of distribution. So, it is sensitive to even a small change in both the factors. That is why it is popular and widely used to determine the status of the ecosystem.
On the other hand, Simpson Index (D) is influenced by dominant species, so, it is used to determine the dominance of species that shows the trend of ecosystem diversity.
Both indices are used to obtain the information that are useful to measure biodiversity of a region.
Alpha (α), Beta (β) and Gamma (γ) diversity
Ecologist often observed that the biodiversity exists in patches or confined to certain localities. The Alpha, Beta and Gama diversity were introduced by R H Whittaker in 1972 to measure biodiversity in a region where the biodiversity is distributed in certain localities or patches.
The total biodiversity in a given area is called Gamma diversity. Gama diversity is dependent on two different findings or observations. These two findings are
1. Alpha (α) diversity and
2. Beta (β) diversity.
Alpha (α) diversity: The biodiversity of certain localities or sites or ecosystem is called Alpha diversity. It provides information about no of species and their abundance in that site. It is based on species richness.
Beta (β) diversity: Differentiation of biodiversity among different sites of a region is called Beta diversity. It is based on the comparison between two sites or localities.
A table may be helpful understanding the concept